Please specify the number of top gene sets to be plotted.
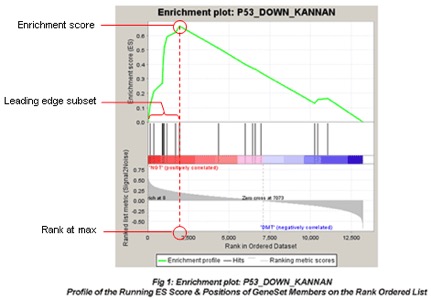
Gene sets are ranked by p-value. Here is an example plot from
https://www.gsea-msigdb.org/gsea/doc/GSEAUserGuideFrame.html.